The Visibility Problem
If your organization runs workloads on AWS Bedrock, you’ve likely asked yourself: how much are we actually spending on AI? Which teams are using it? What models are they calling, and how efficiently?
AWS provides CloudWatch logs for Bedrock invocations, but raw logs don’t answer business questions. You need aggregation, cost attribution, trend analysis, and team-level breakdowns. Building that from scratch means stitching together CloudWatch Insights queries, spreadsheets, and custom dashboards - a tedious, ongoing effort.
I built Dashrock to solve this. It’s an open-source analytics dashboard that turns your Bedrock invocation logs into actionable insights - deployed entirely within your own AWS account.
What Dashrock Does
Dashrock collects Bedrock invocation logs from CloudWatch, processes them hourly, and presents the data through seven focused dashboard views.
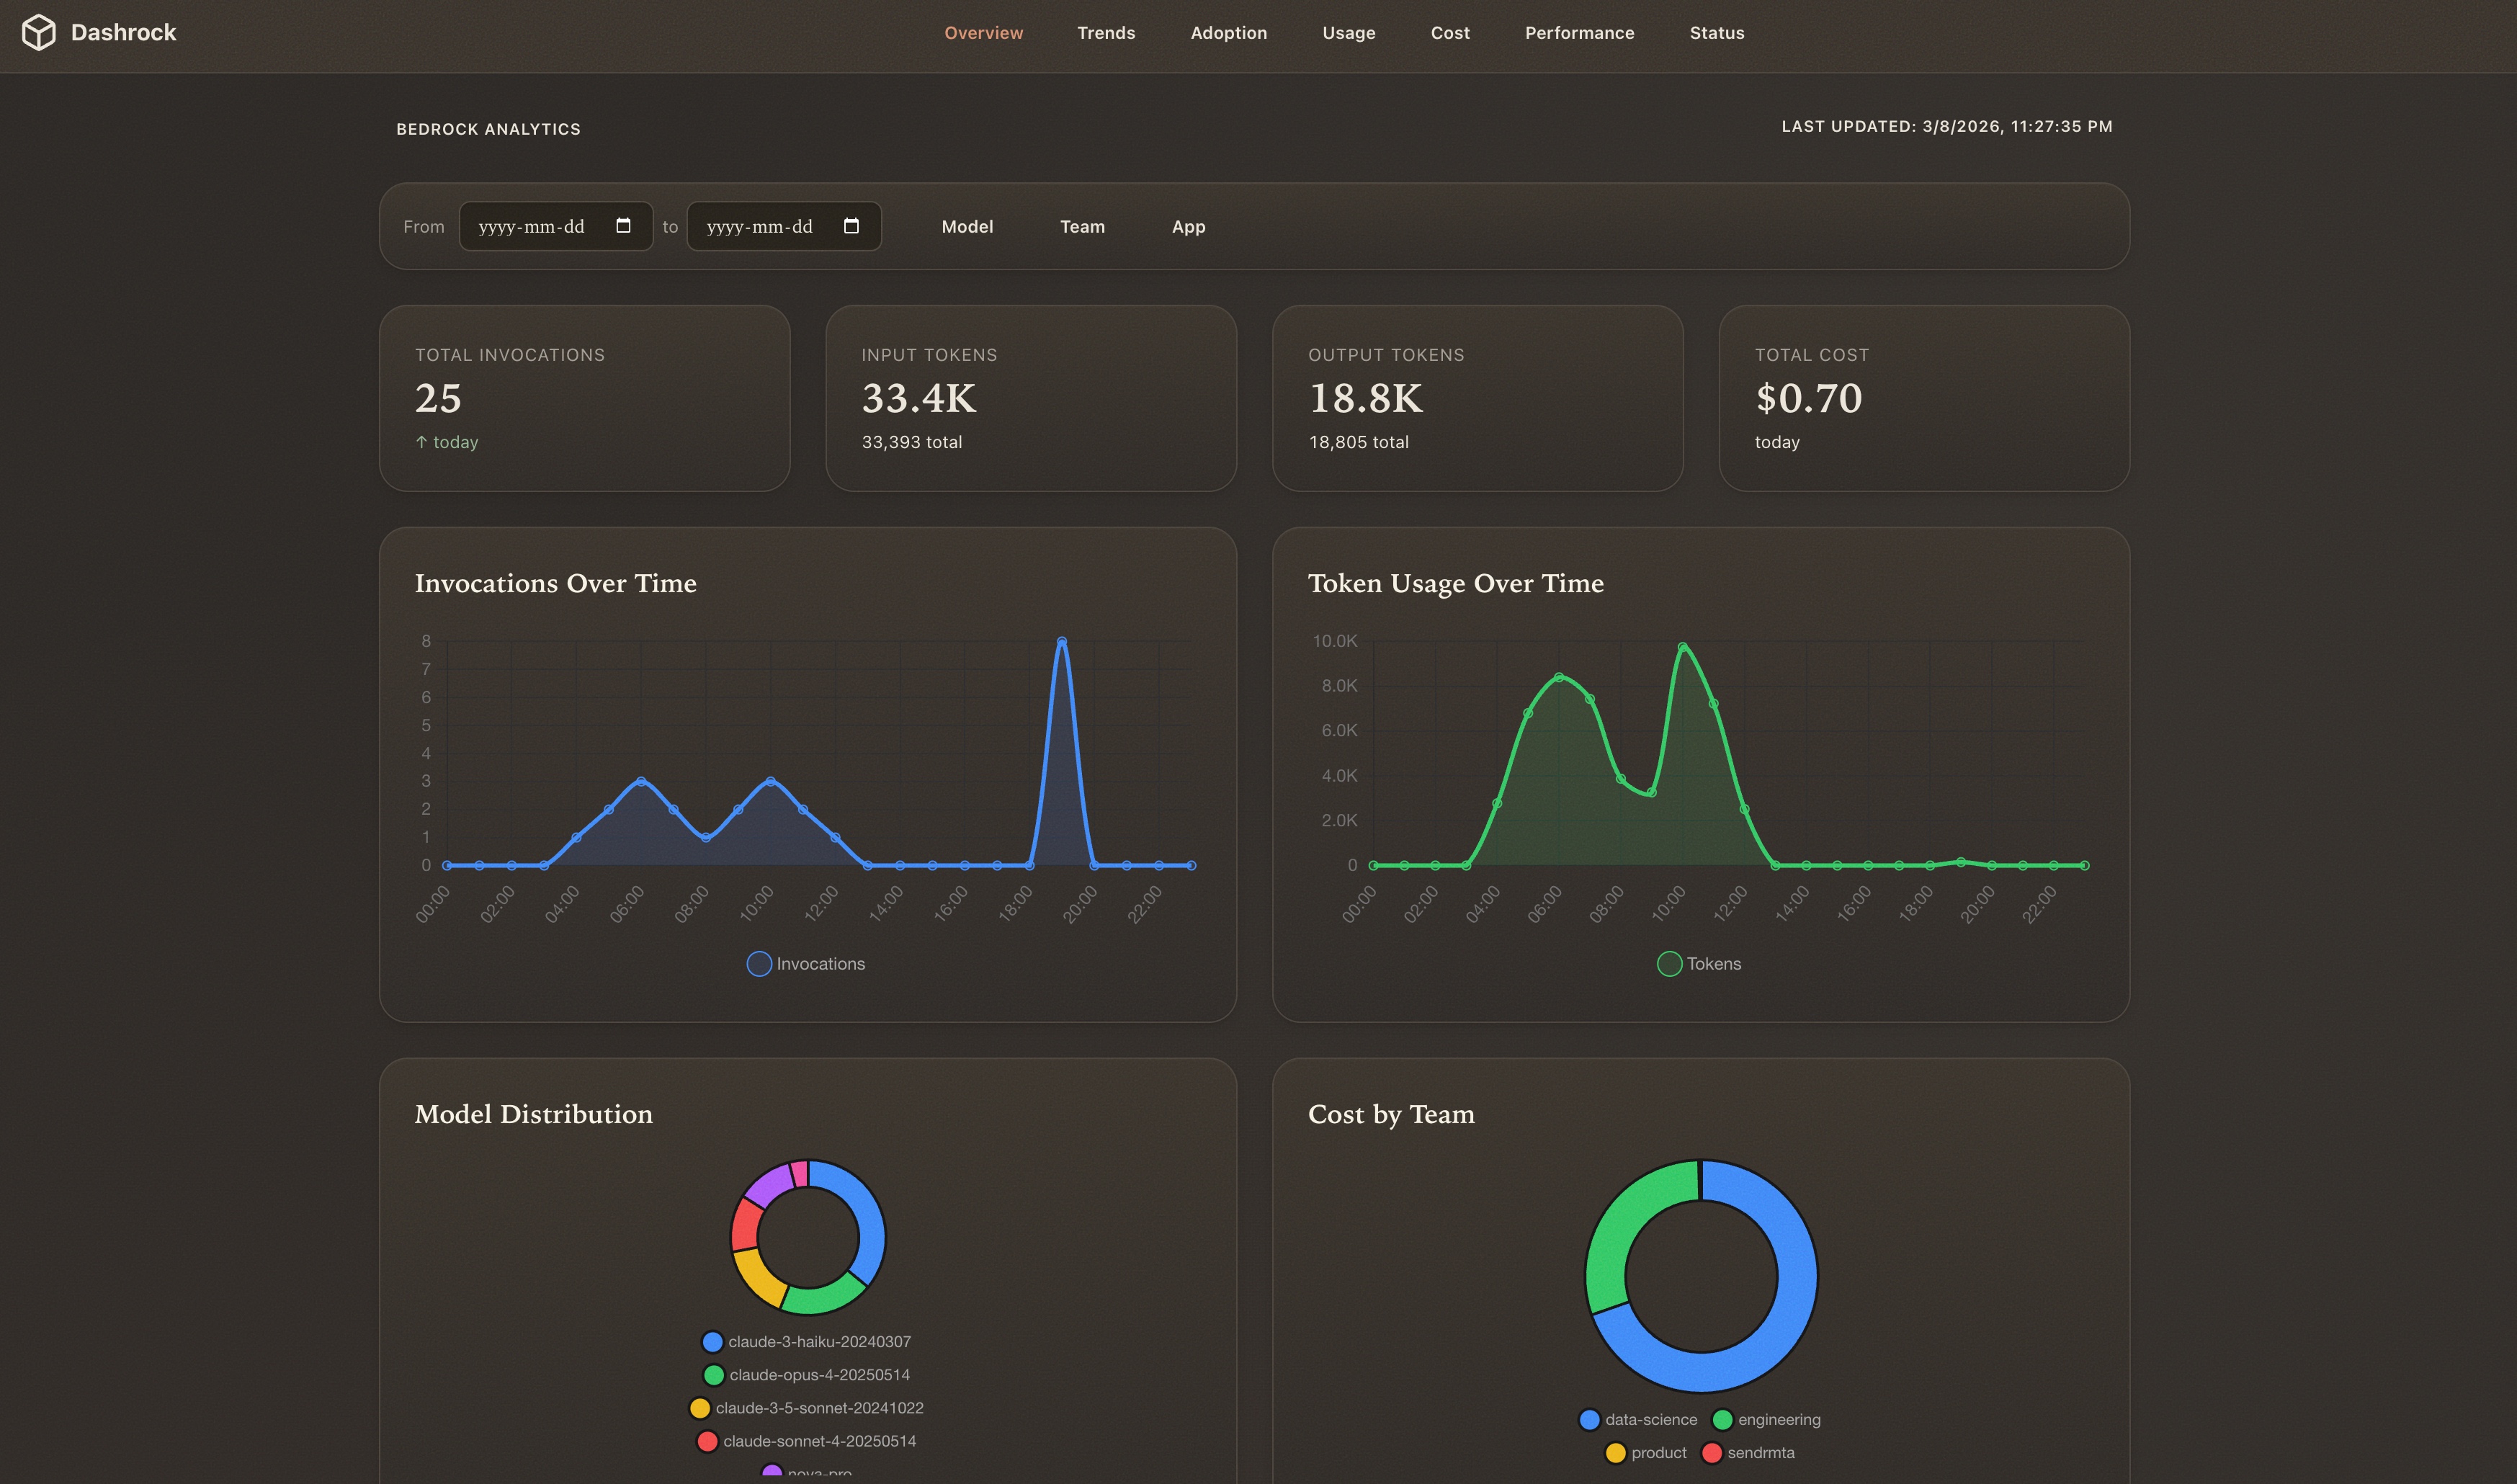
Overview
The main dashboard gives you an at-a-glance summary: total invocations, input and output tokens, estimated cost, a timeline of recent activity, model distribution, and cost broken down by team.
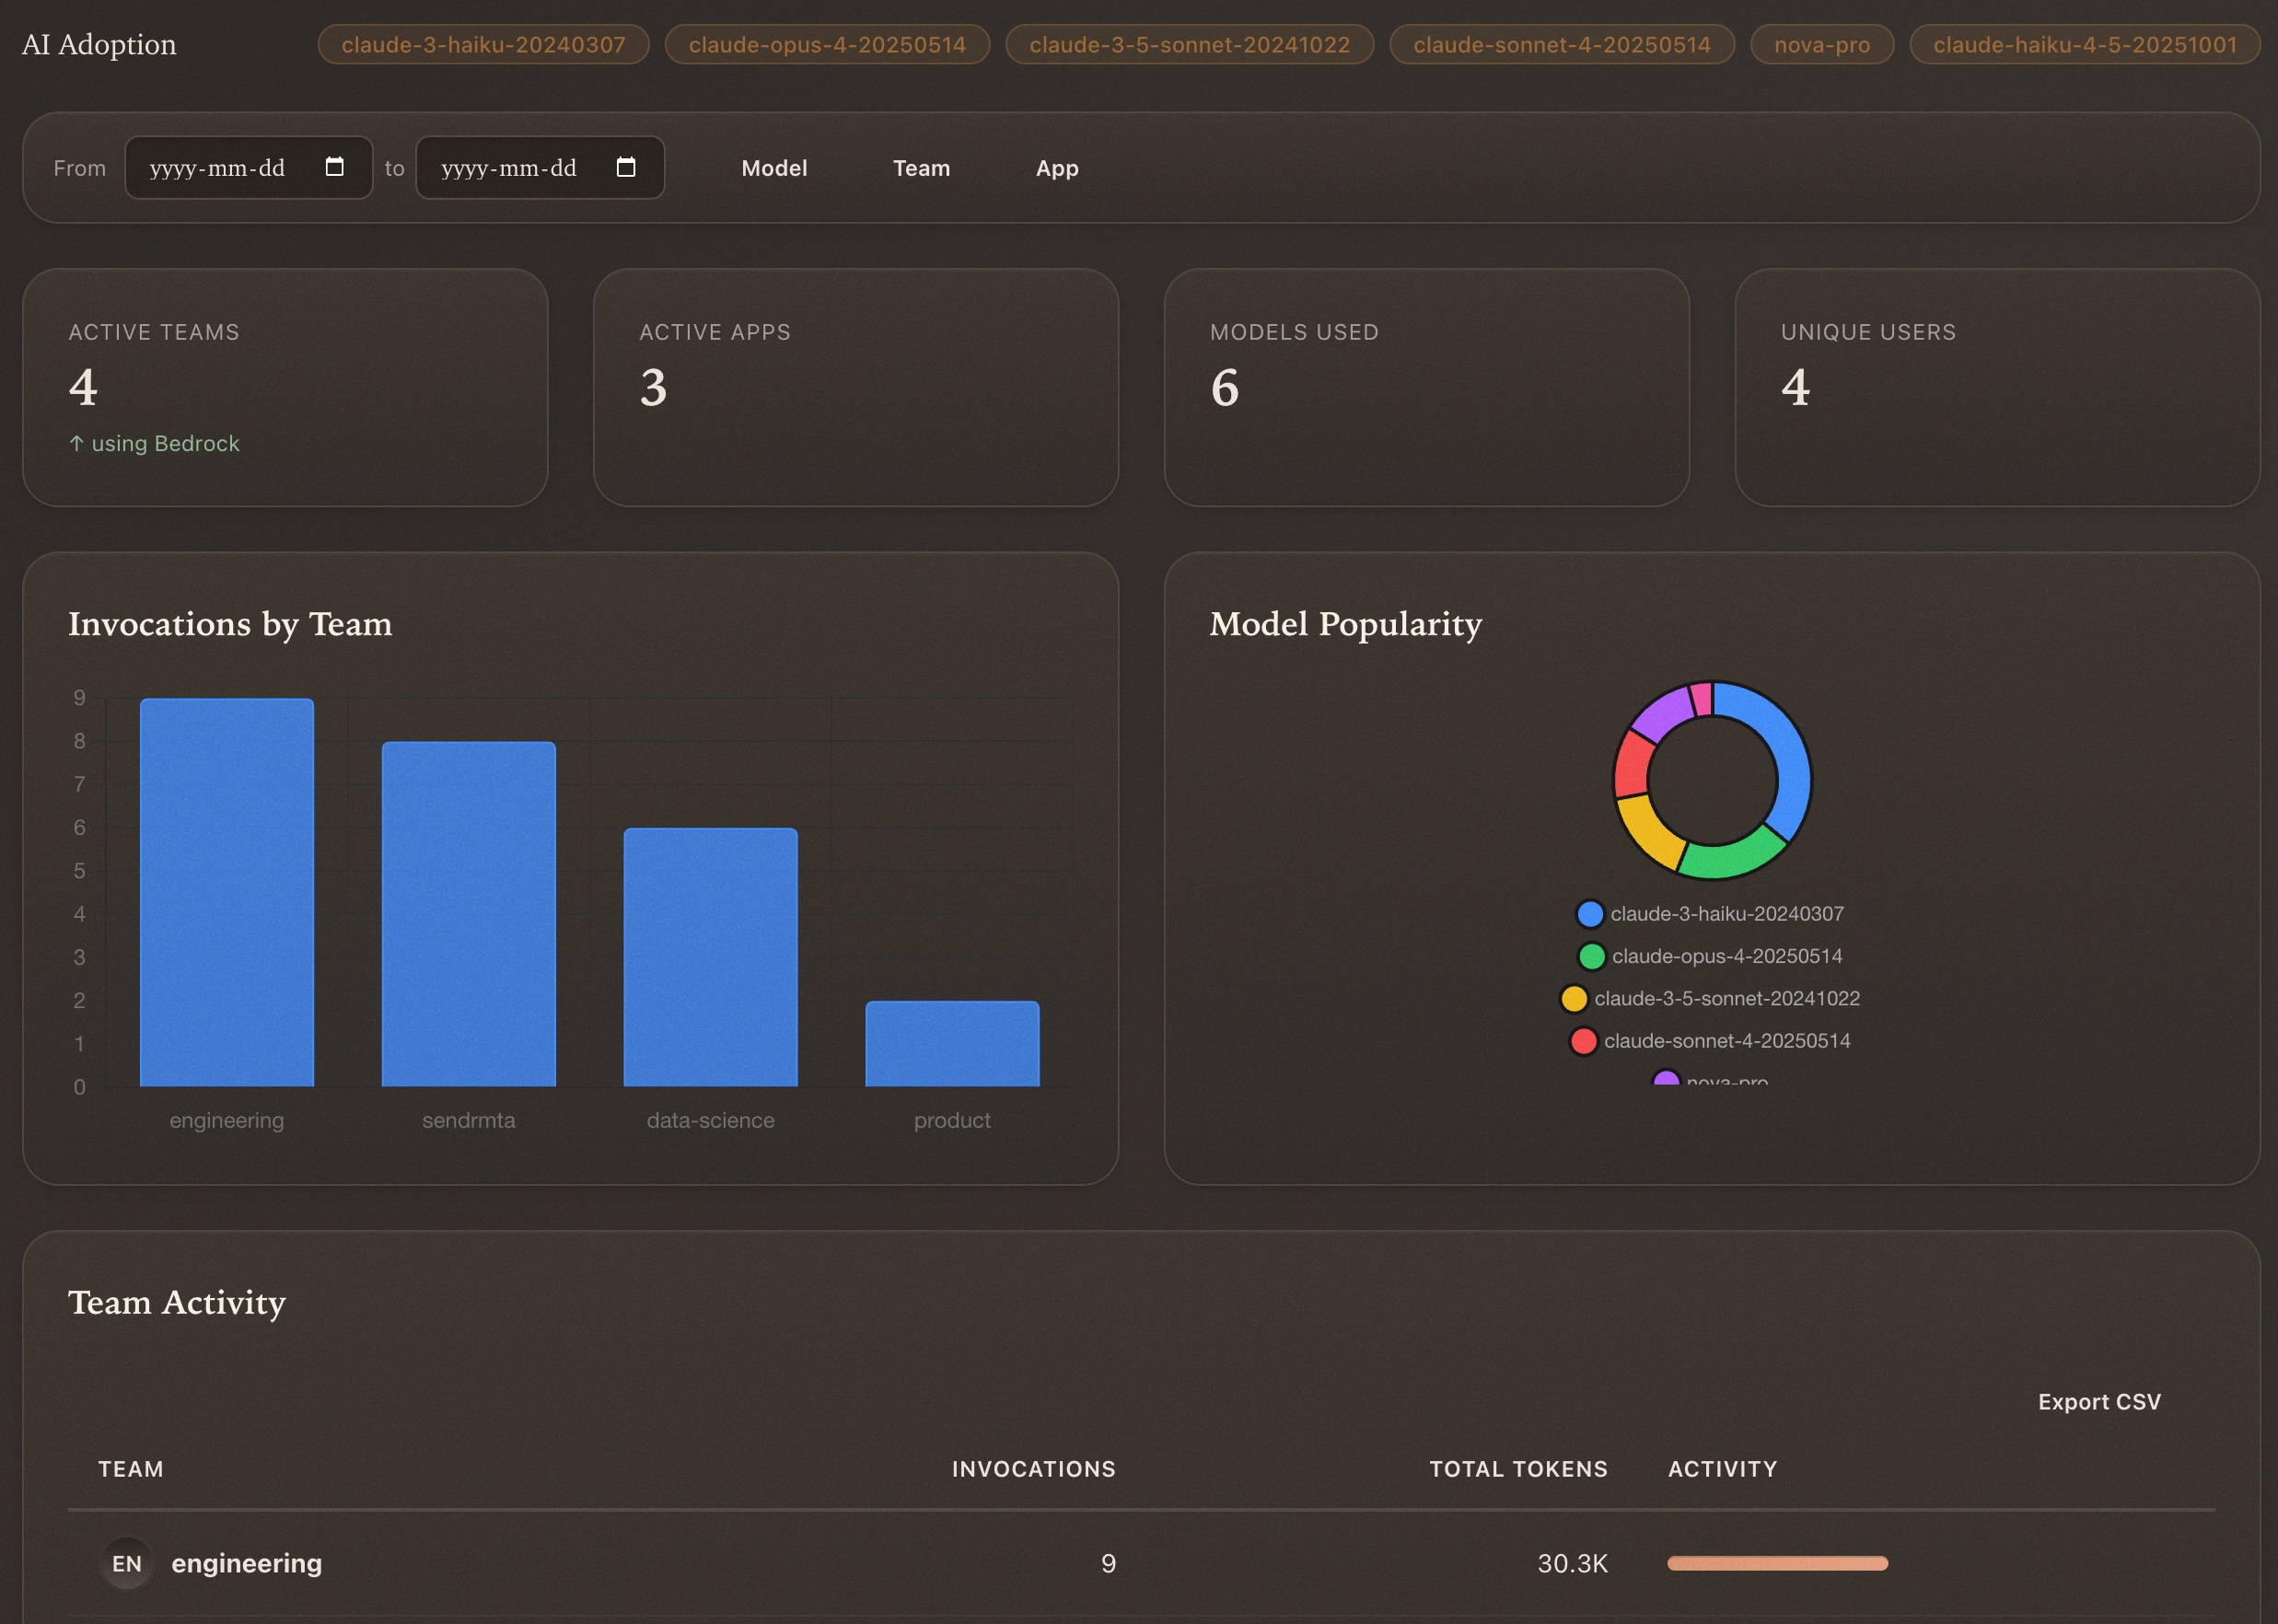
AI Adoption
Track which teams and applications are actively using Bedrock. See the number of active teams, applications, unique models in use, and how invocations distribute across your organization.
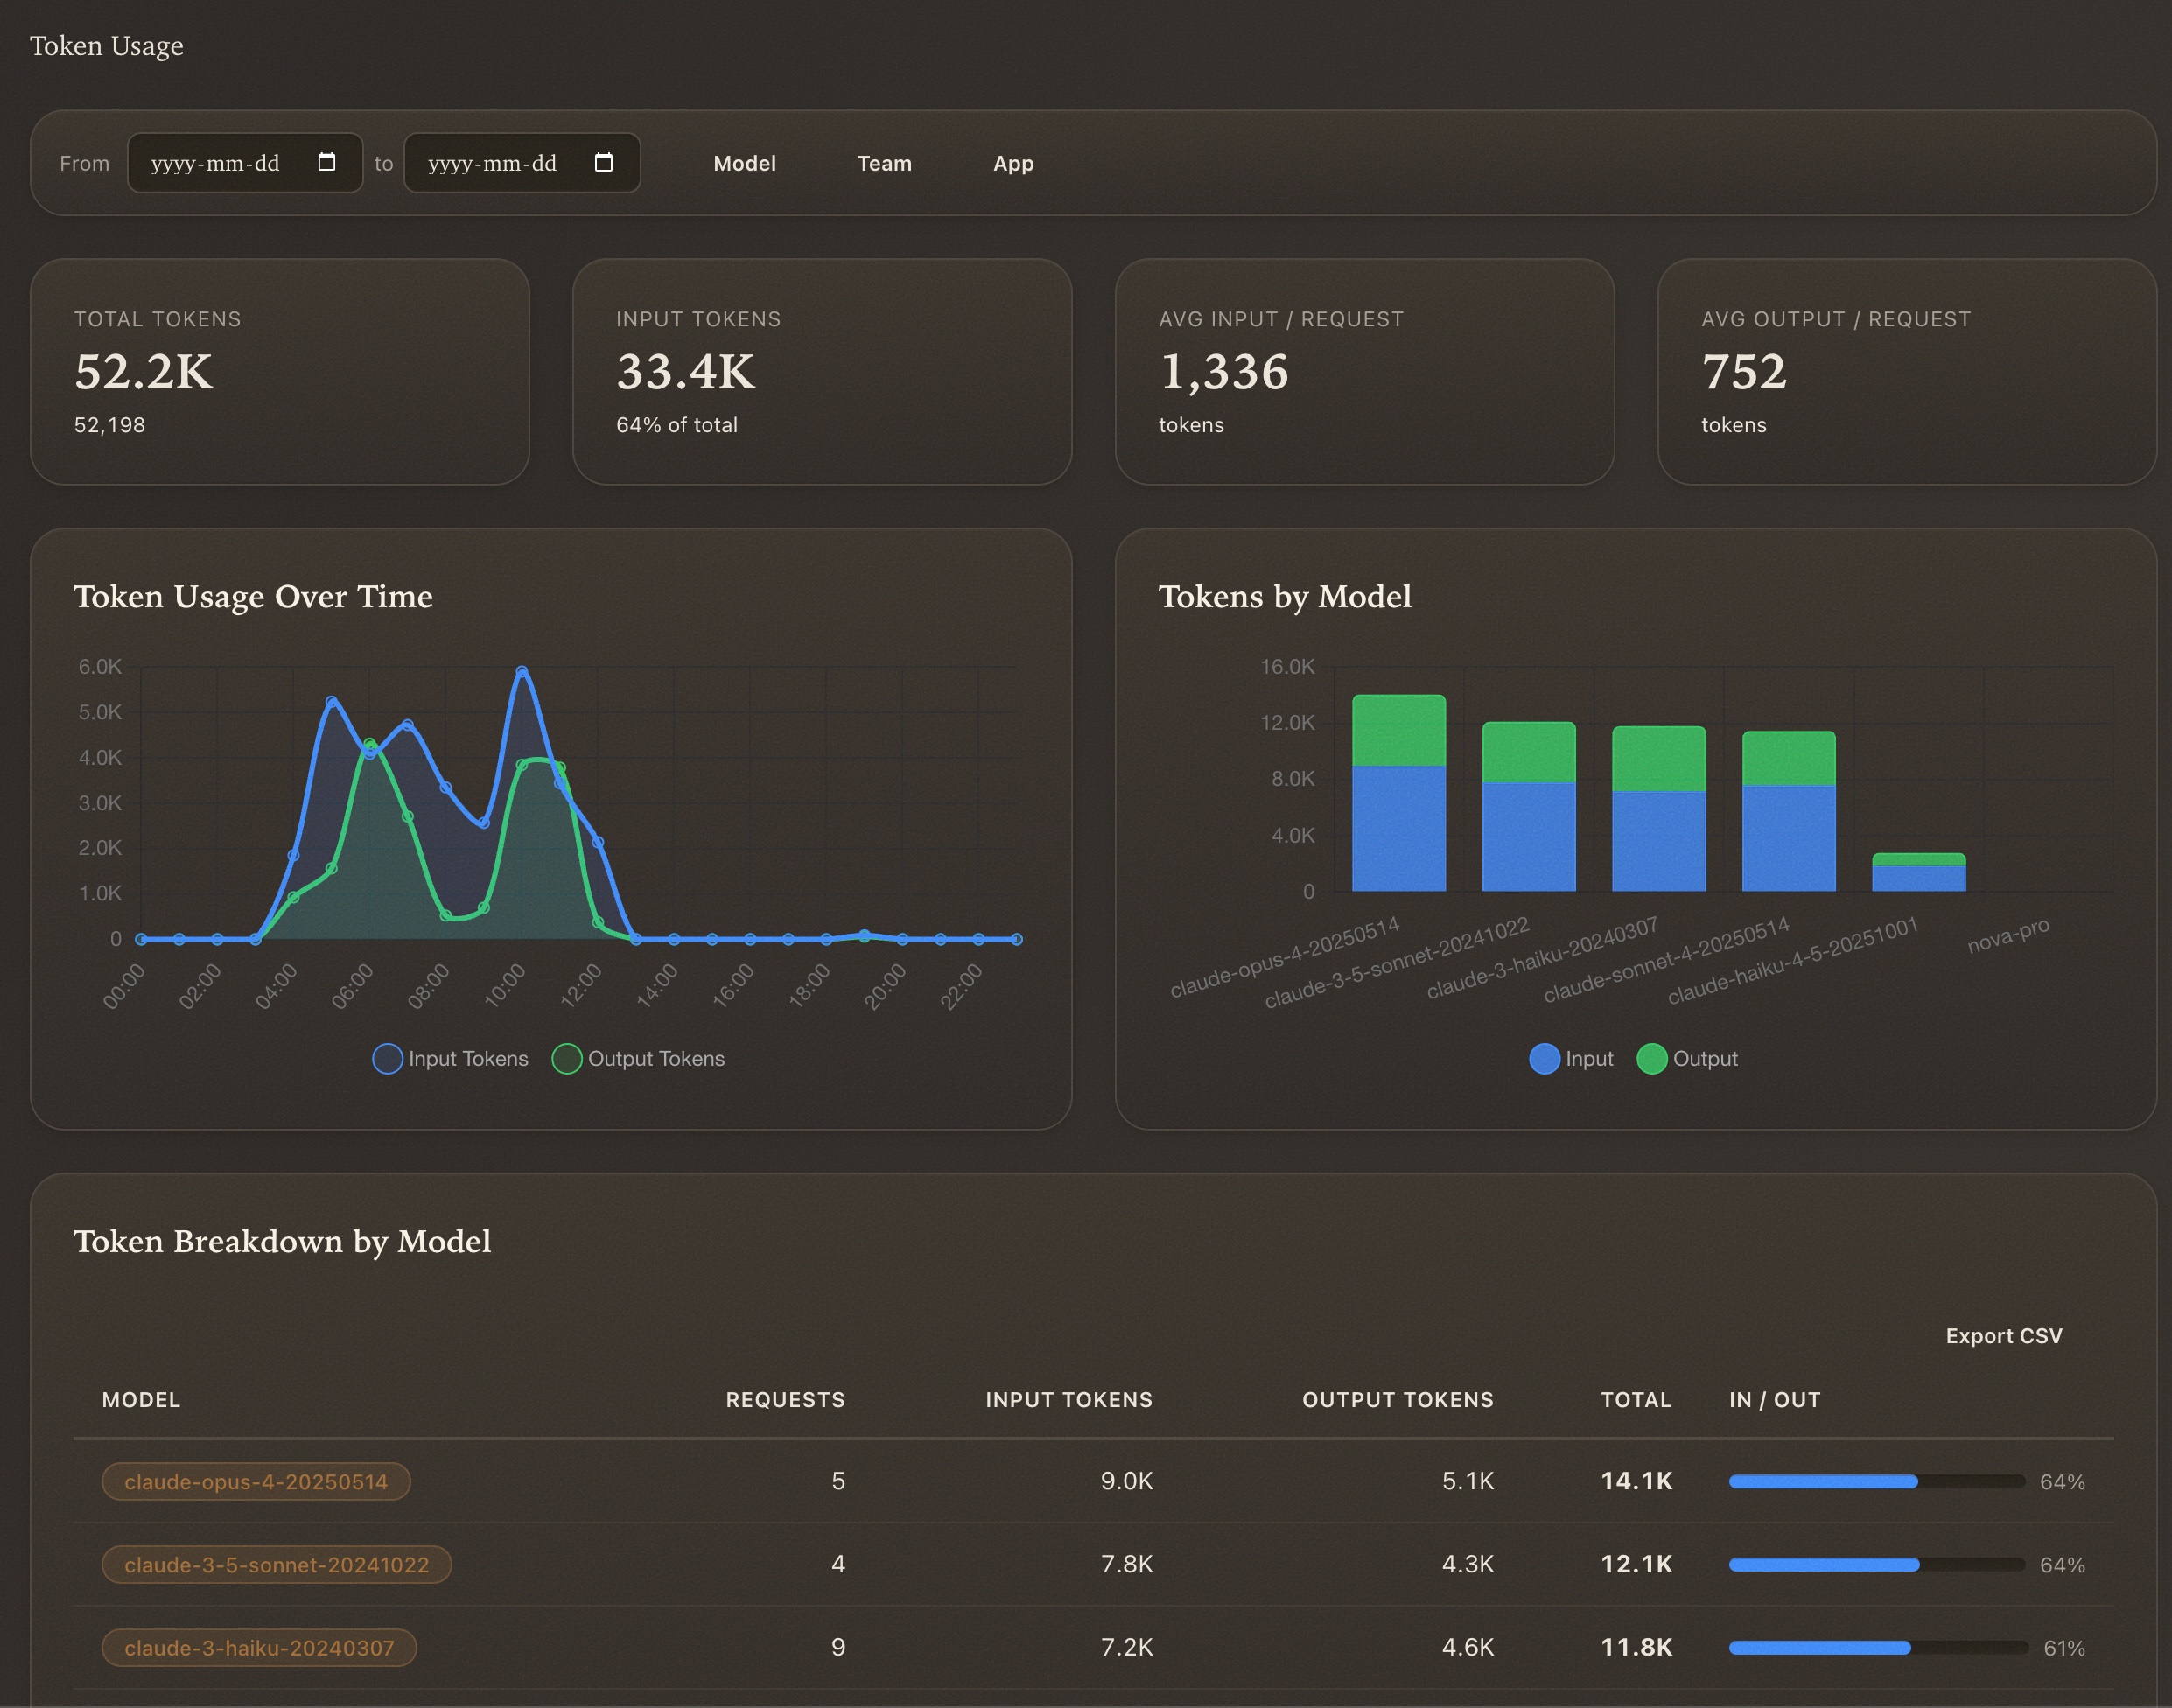
Token Usage
Deep dive into token consumption - total tokens, input/output breakdown, usage over time, tokens by model, and per-model input/output ratios. This view helps you understand whether your prompts are efficient or if certain models are receiving unnecessarily large inputs.
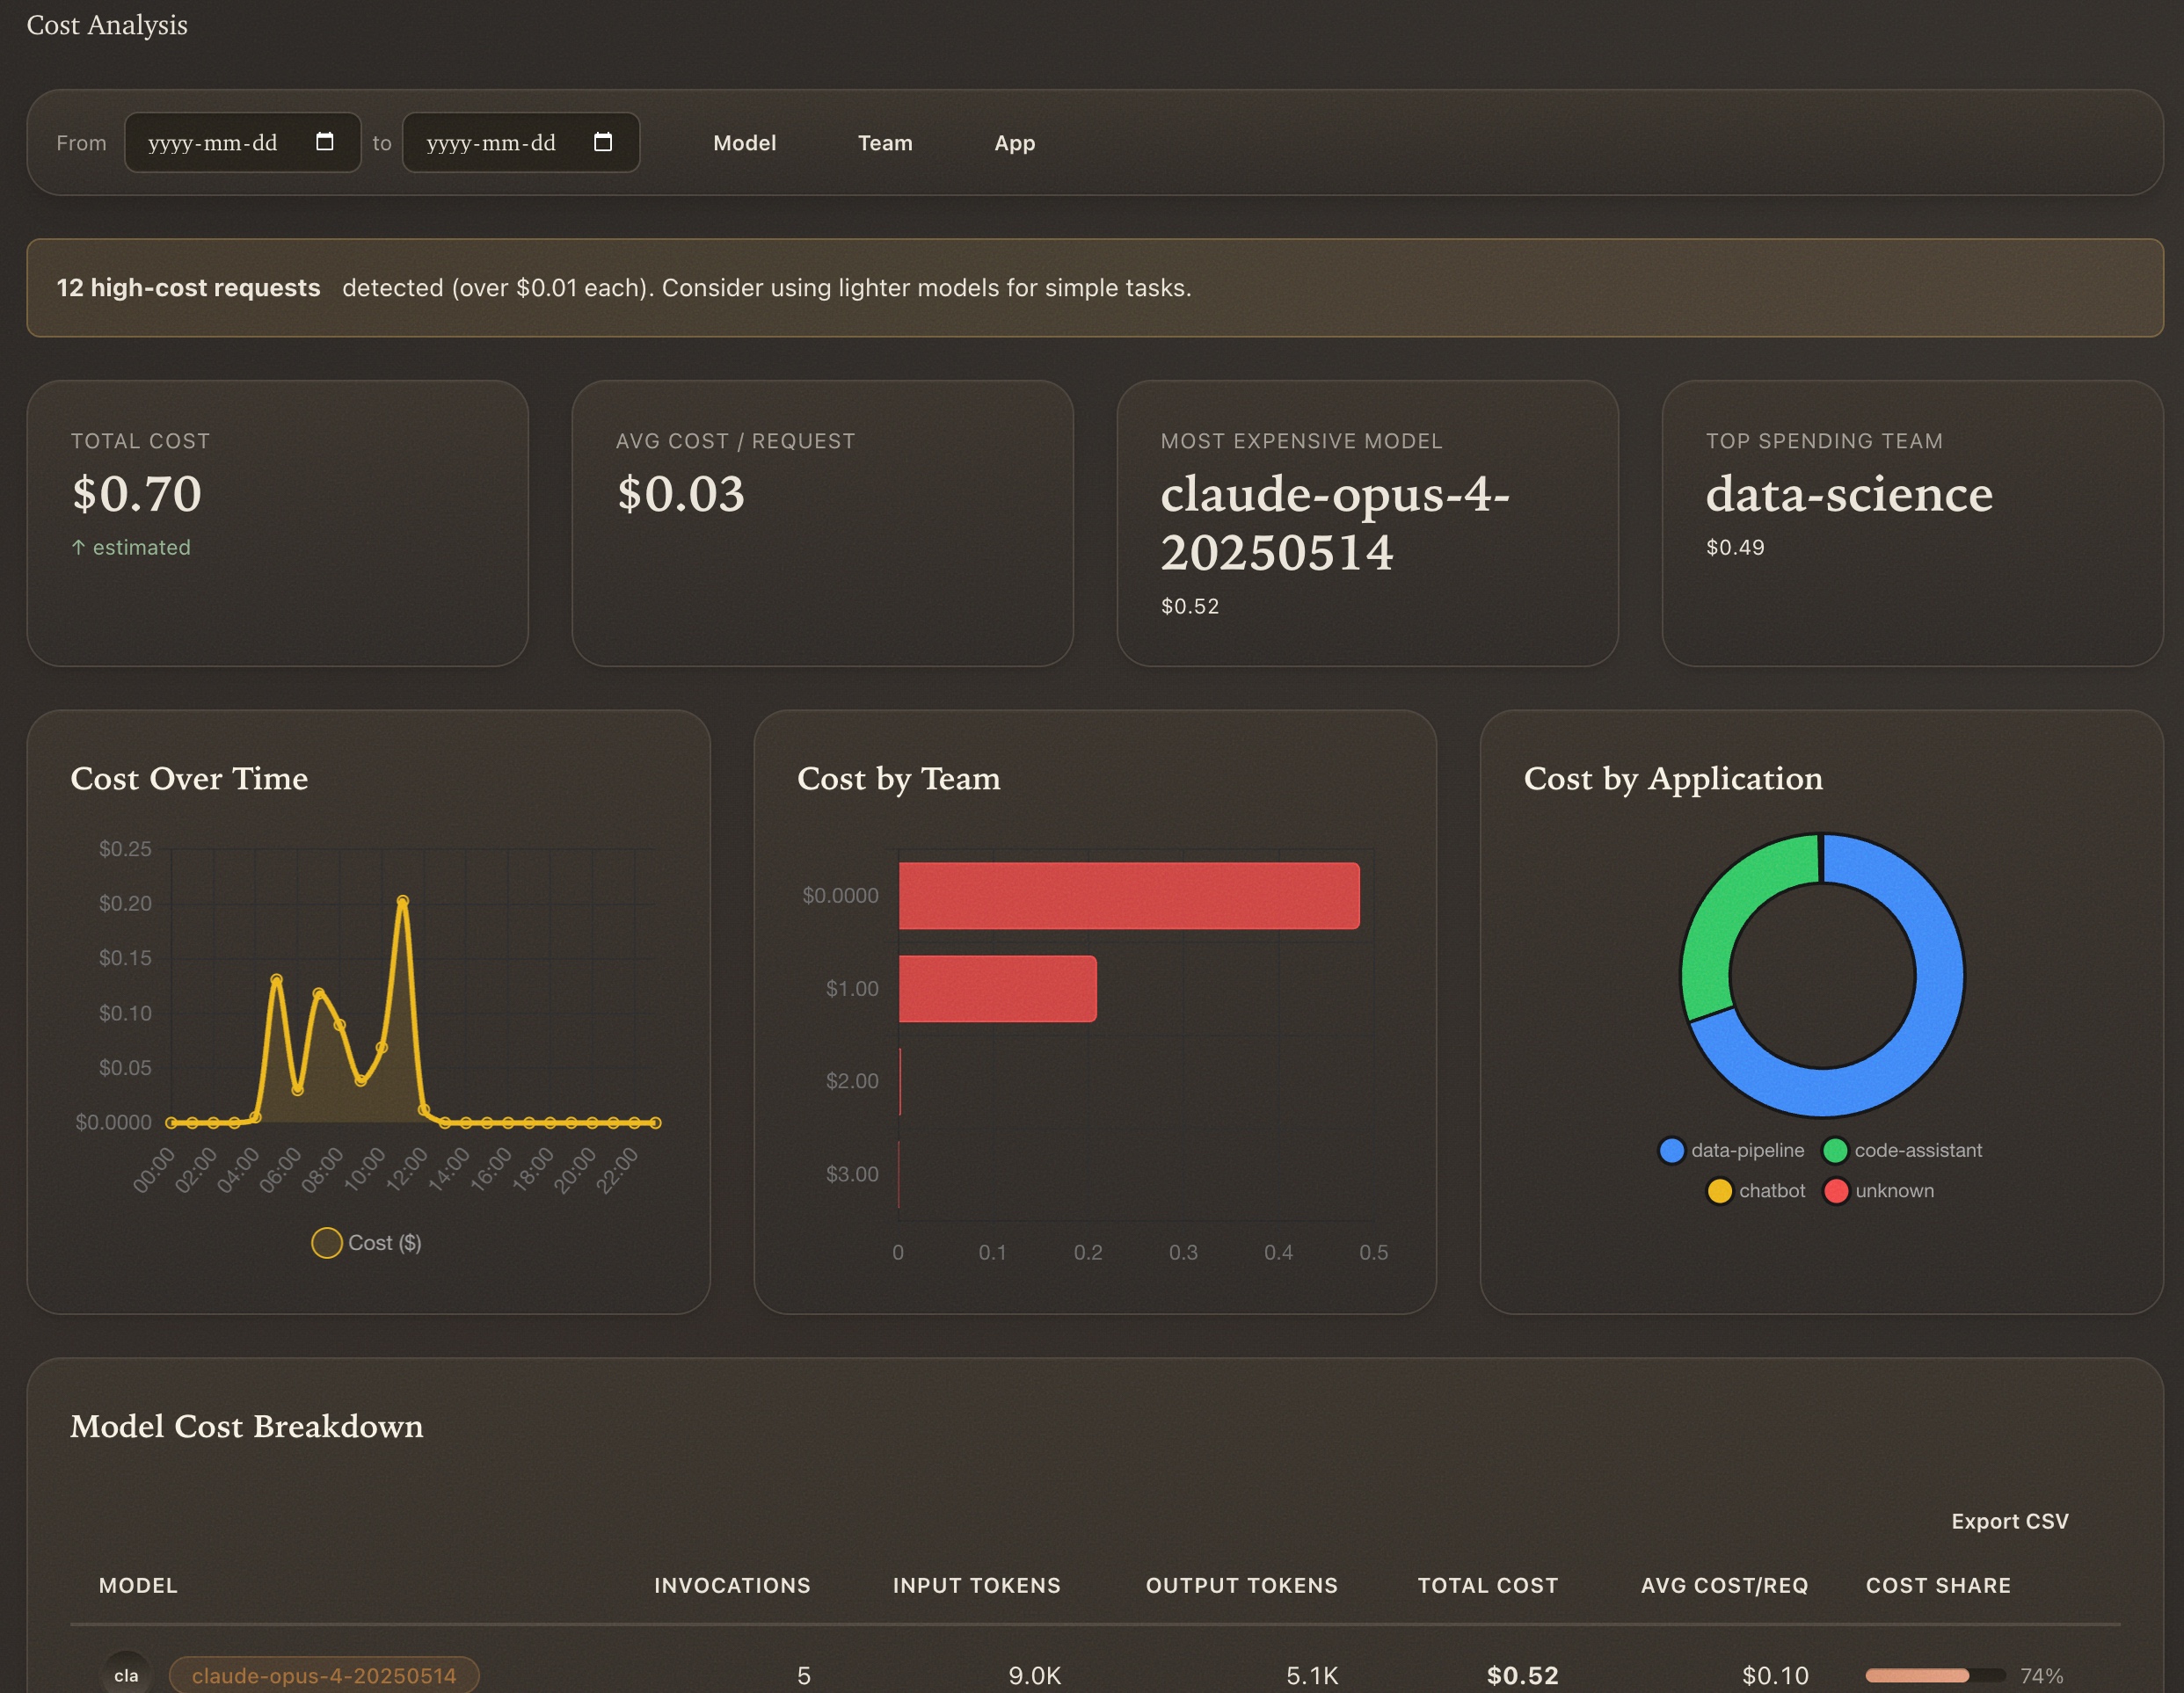
Cost Analysis
Dashrock applies automatic per-model pricing to every invocation. You get total cost, cost per request averages, the most expensive model, top spending team, cost over time, and cost by application. No more guessing what your AI bill will look like.
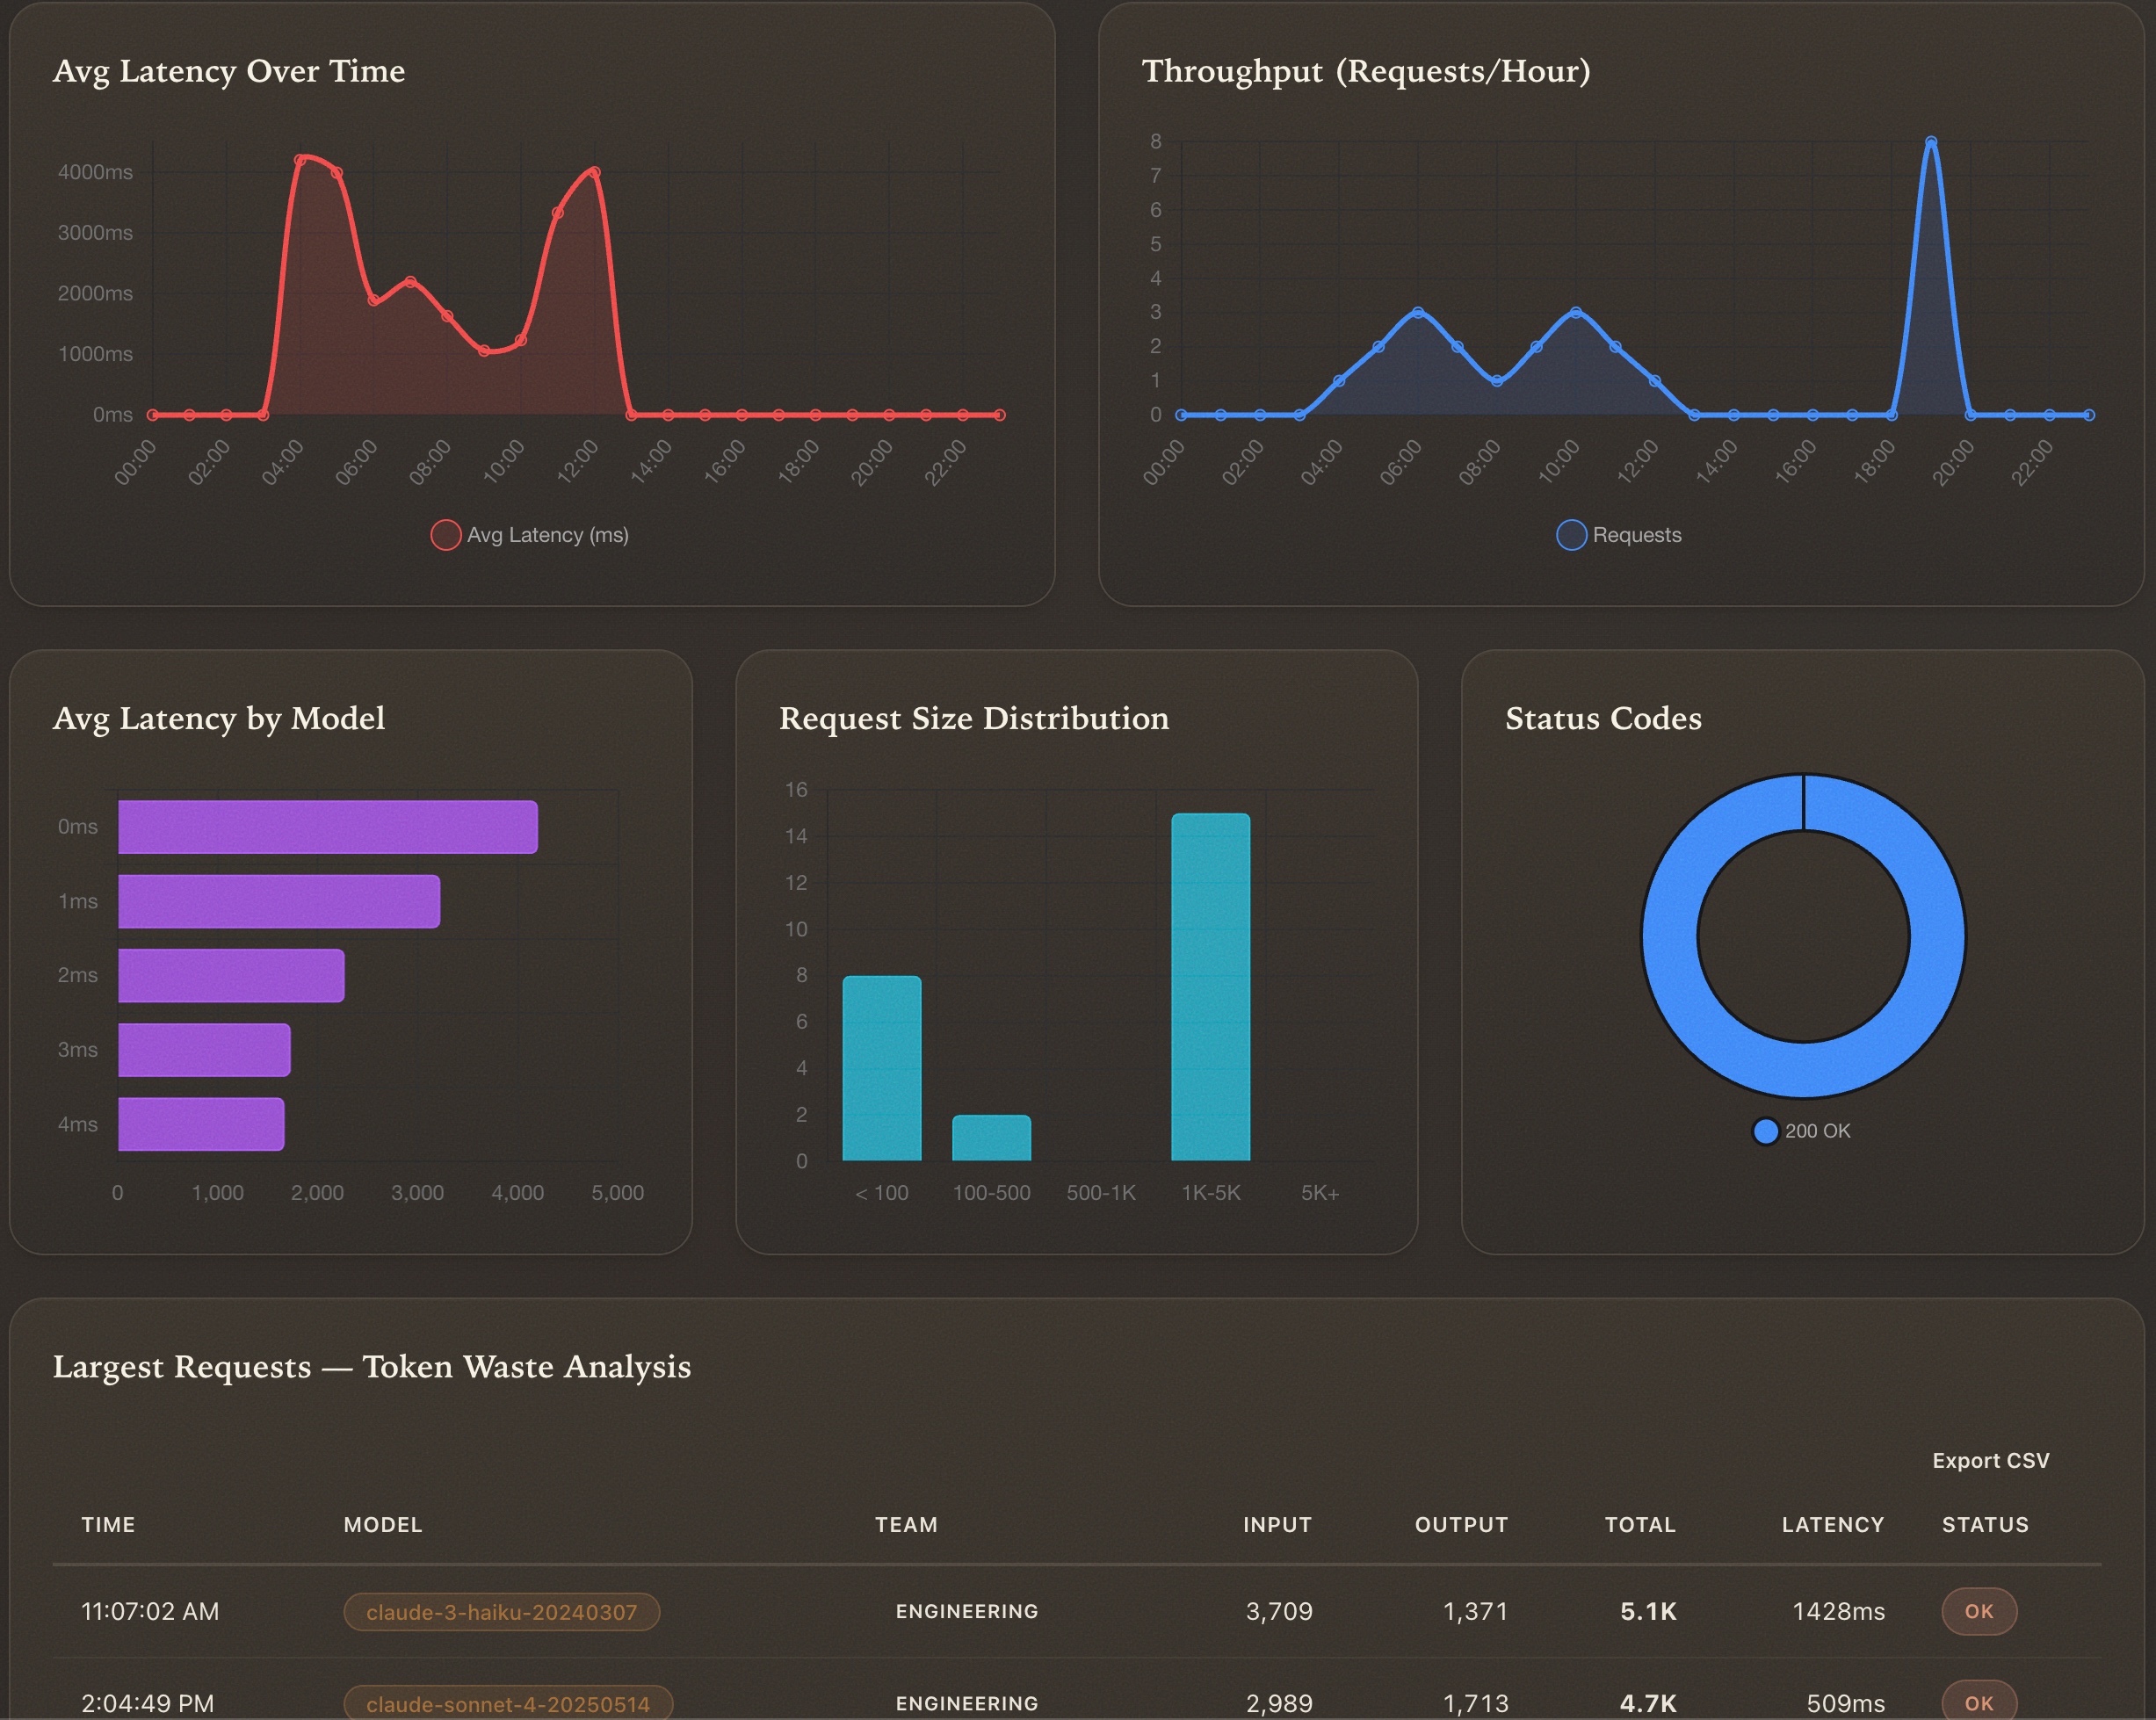
Performance
Monitor latency over time, throughput per hour, latency by model, request size distribution, and status codes. This view also surfaces the largest requests - useful for identifying token waste.
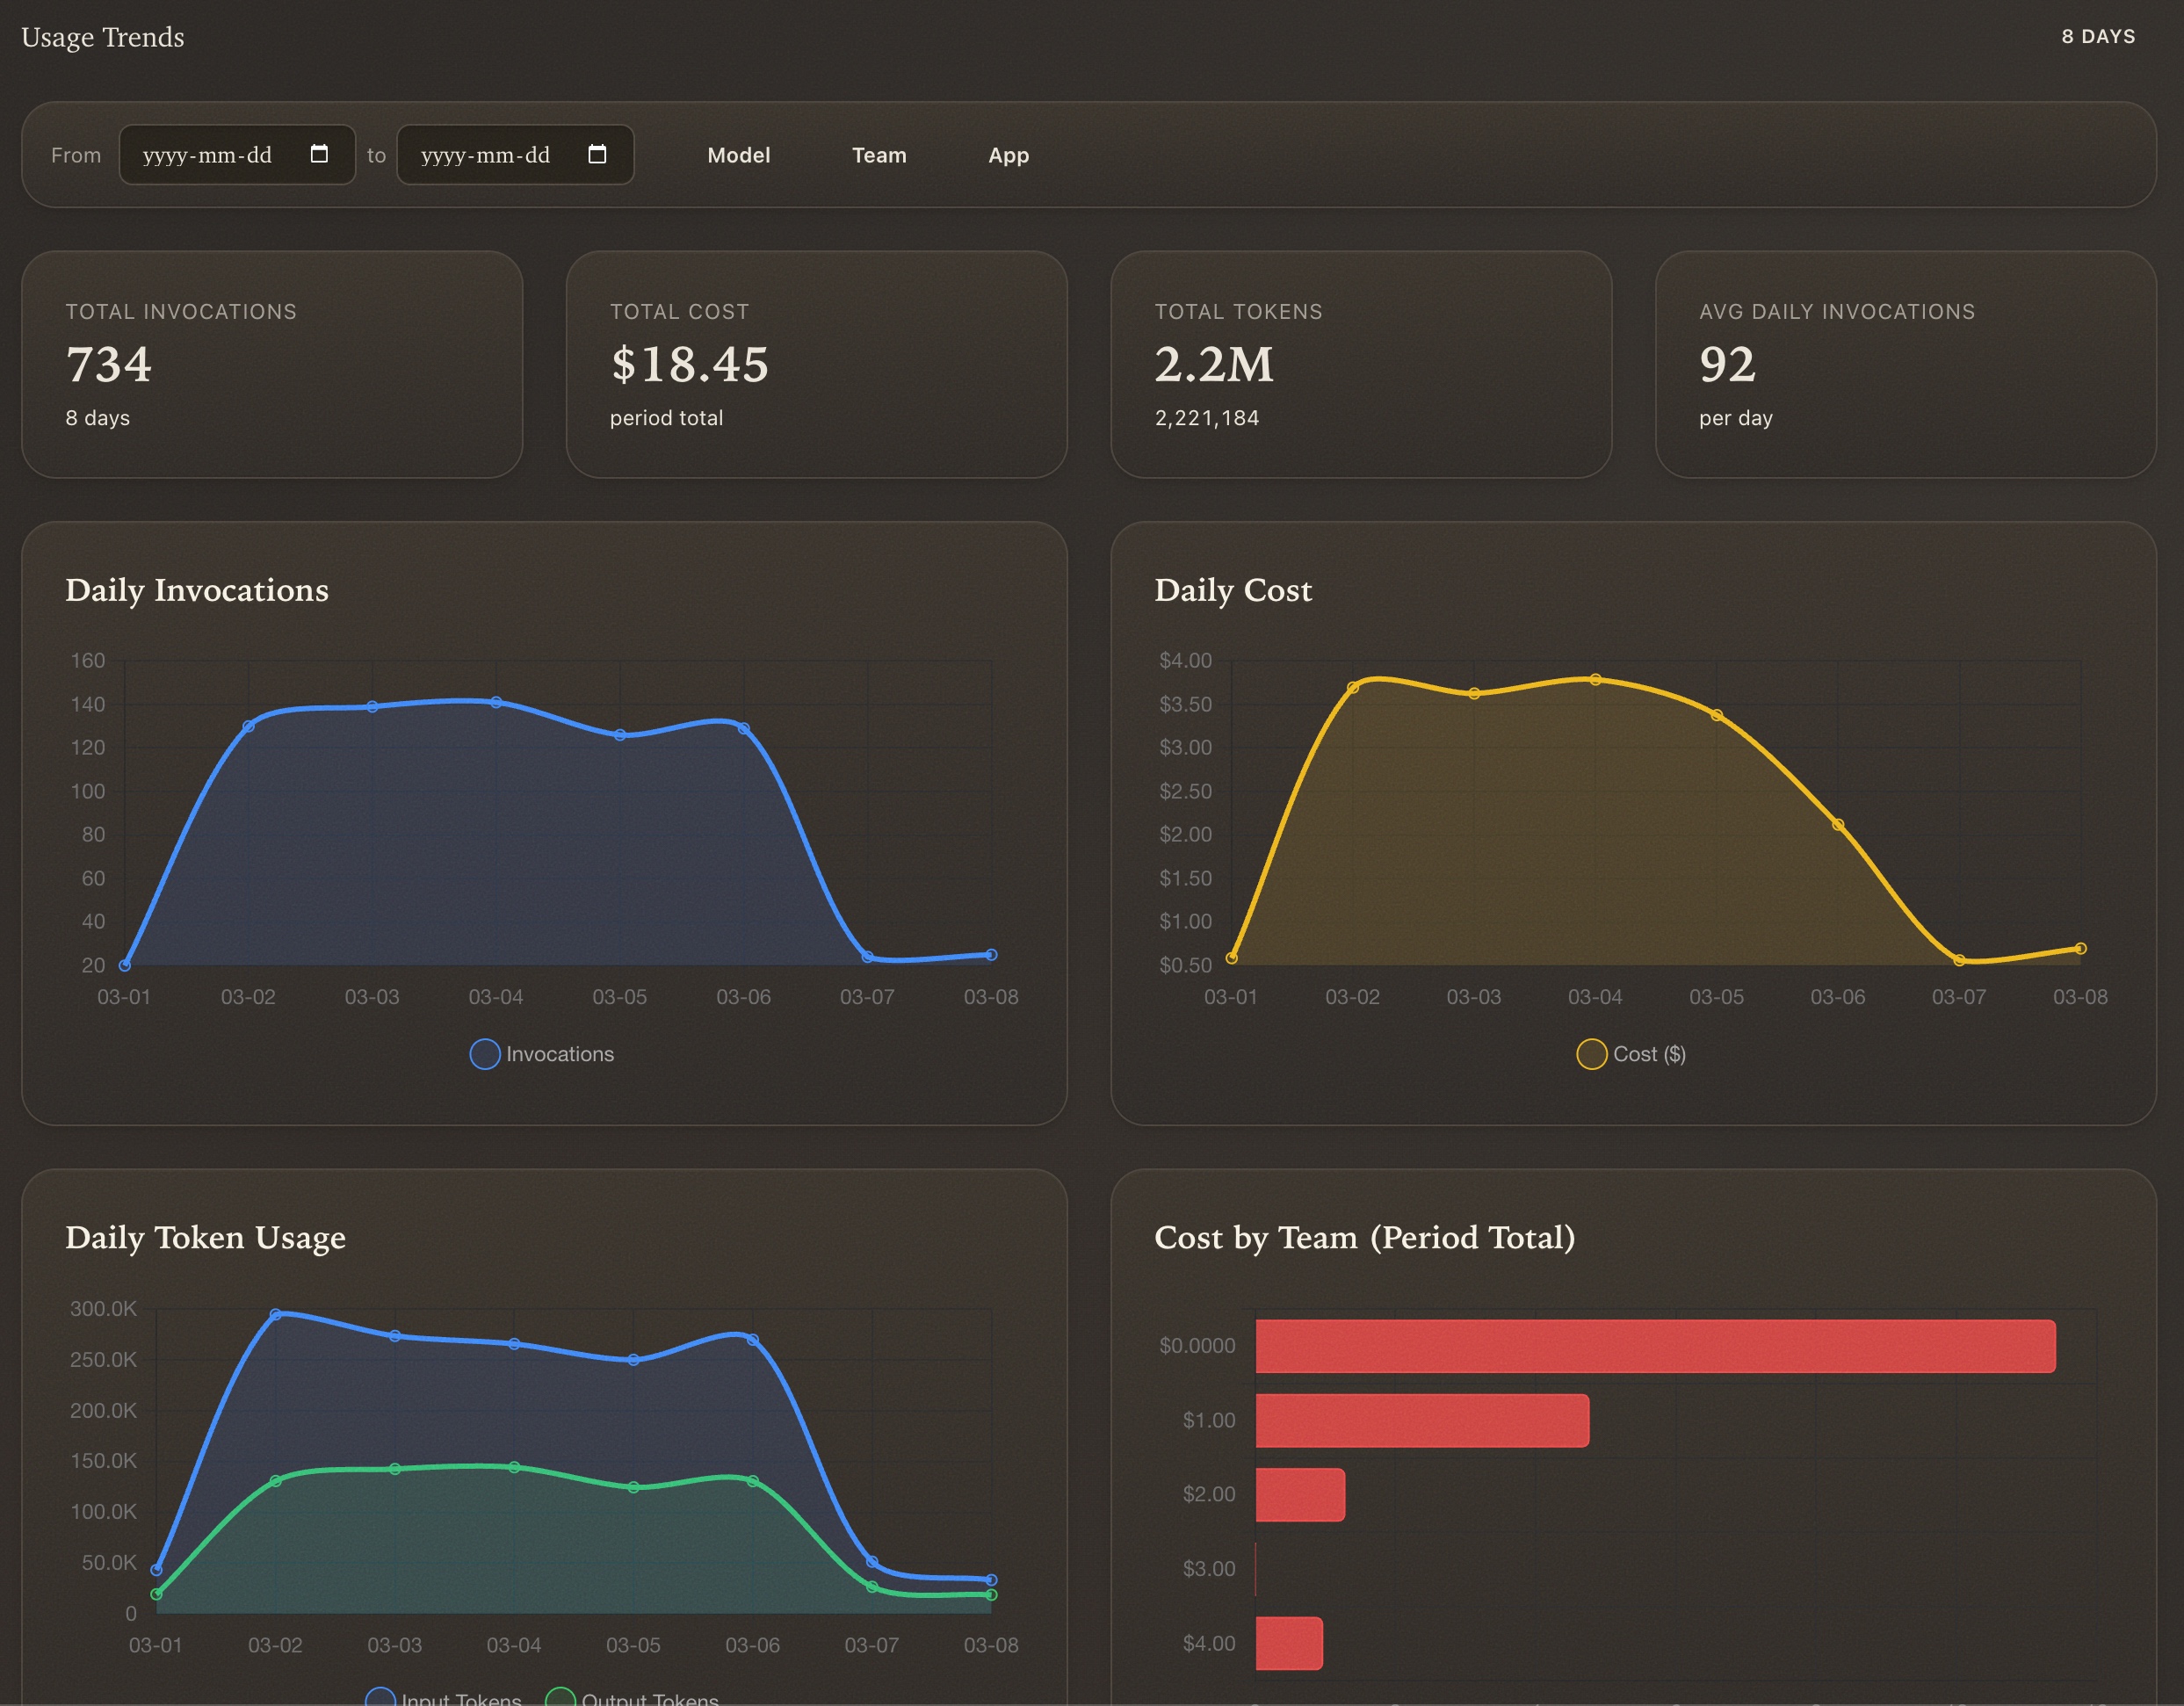
Trends
Historical analysis over configurable date ranges. Daily invocations, daily cost, daily token usage, and cost by team over any period you choose.
Architecture
The system is fully serverless and costs nearly nothing to run:
CloudWatch Logs (Bedrock invocation logs)
        ↓
EventBridge (hourly schedule)
        ↓
Lambda Collector → S3 (raw + aggregated data)
                     ↓
Next.js Dashboard (CloudFront + Lambda@Edge)
A collector Lambda runs every hour via EventBridge, reads Bedrock invocation logs from CloudWatch, extracts token counts, costs, and team/app assignments, then stores raw hourly data plus daily and monthly aggregates in S3. The Next.js dashboard reads from S3 - no database required.
All data stays within your AWS account. Nothing leaves your infrastructure.
Configuration
Dashrock uses a YAML config file to map IAM principals to human-readable team and application names:
teams:
  - name: ML Platform
    principals:
      - arn:aws:iam::123456789:role/ml-platform-role
  - name: Product
    principals:
      - arn:aws:iam::123456789:role/product-bedrock-role

apps:
  - name: Search Assistant
    principals:
      - arn:aws:iam::123456789:role/search-assistant

pricing:
  claude-sonnet:
    input: 3.0
    output: 15.0
Updating this config doesn’t require redeployment - just upload the new file to S3.
Deployment
Dashrock uses SST for infrastructure. Deployment takes about three minutes:
- Enable Bedrock model invocation logging in your AWS account
- Clone the repo and run
npm run deploy - Configure your teams in
dashrock.config.yaml
The stack provisions all necessary resources: the S3 bucket, Lambda functions, EventBridge rule, CloudFront distribution, and IAM roles with least-privilege permissions.
Optional features include HTTP Basic Auth via CloudFront Lambda@Edge and custom domain support through Route 53.
Tech Stack
- Frontend: Next.js, React, TypeScript, Tailwind CSS, Chart.js
- Infrastructure: SST, AWS Lambda, S3, CloudFront, EventBridge
- Data source: AWS CloudWatch Logs (Bedrock invocation logs)
- Cost: ~$0/month for typical usage (serverless, S3 storage only)
Why Open Source
Enterprise AI observability tools exist, but they typically require sending your data to a third party, come with per-seat pricing, and offer far more than you need if your only goal is understanding Bedrock usage within your AWS account.
Dashrock takes the opposite approach: deploy it in your account, own your data, pay nothing beyond marginal AWS costs. The code is on GitHub - contributions welcome.
Check it out at dashrock.app.