The Problem with Pipeline Readability
WDL (Workflow Description Language) is the standard for defining genomics pipelines - GATK best practices, nf-core workflows, and most production bioinformatics infrastructure use it. But WDL files are code, and code is hard to reason about spatially.
When you’re reviewing a pipeline with twenty tasks, scatter blocks, conditionals, and data dependencies threading between them, reading the WDL source top to bottom doesn’t give you the picture. You need an actual picture.
Existing options are limited. You can manually draw the DAG in a diagramming tool, but that gets stale the moment the pipeline changes. Cromwell’s metadata API gives you runtime execution graphs, but only after you’ve run the workflow. There’s nothing that takes a WDL file and gives you a visual representation of the workflow structure at authoring time.
I built wdldraw to fill that gap.
What wdldraw Does
wdldraw parses a WDL file and produces an interactive Excalidraw diagram of the workflow. It handles the full WDL 1.x grammar:
- Task calls rendered as blue rounded rectangles
- Scatter blocks shown as purple dashed containers grouping their parallel calls
- Conditionals displayed as yellow diamonds with branching edges
- Data-flow edges drawn as gray arrows labeled with the output being passed
The output is standard Excalidraw JSON - you can open it in excalidraw.com, edit it, export it, or embed it in documentation.
How It Works
The pipeline has four stages:
WDL source → tree-sitter parser → IR graph → dagre layout → Excalidraw JSON
1. Parsing
wdldraw uses tree-sitter-wdl to parse WDL into a concrete syntax tree. Tree-sitter gives us a proper AST with full fidelity - no regex hacks or partial parsing. It handles workflow blocks, task definitions, call statements with aliases, scatter expressions, conditionals, and qualified identifiers for imported tasks.
2. Intermediate Representation
The syntax tree gets transformed into a graph IR - nodes for each call, scatter, and conditional, plus edges derived from data-flow analysis. When a task references SomeTask.output_bam, wdldraw traces that back to the producing call and creates a dependency edge.
3. Layout
Node positions are computed using dagre, a directed graph layout library. It supports both top-to-bottom and left-to-right orientations. Compound nodes (scatter blocks containing multiple calls) are handled as subgraphs so their children are visually grouped.
4. Rendering
The positioned graph is converted to Excalidraw’s JSON format. Each node type gets distinct visual styling - colors, border patterns, shapes - so you can immediately tell calls from scatters from conditionals at a glance.
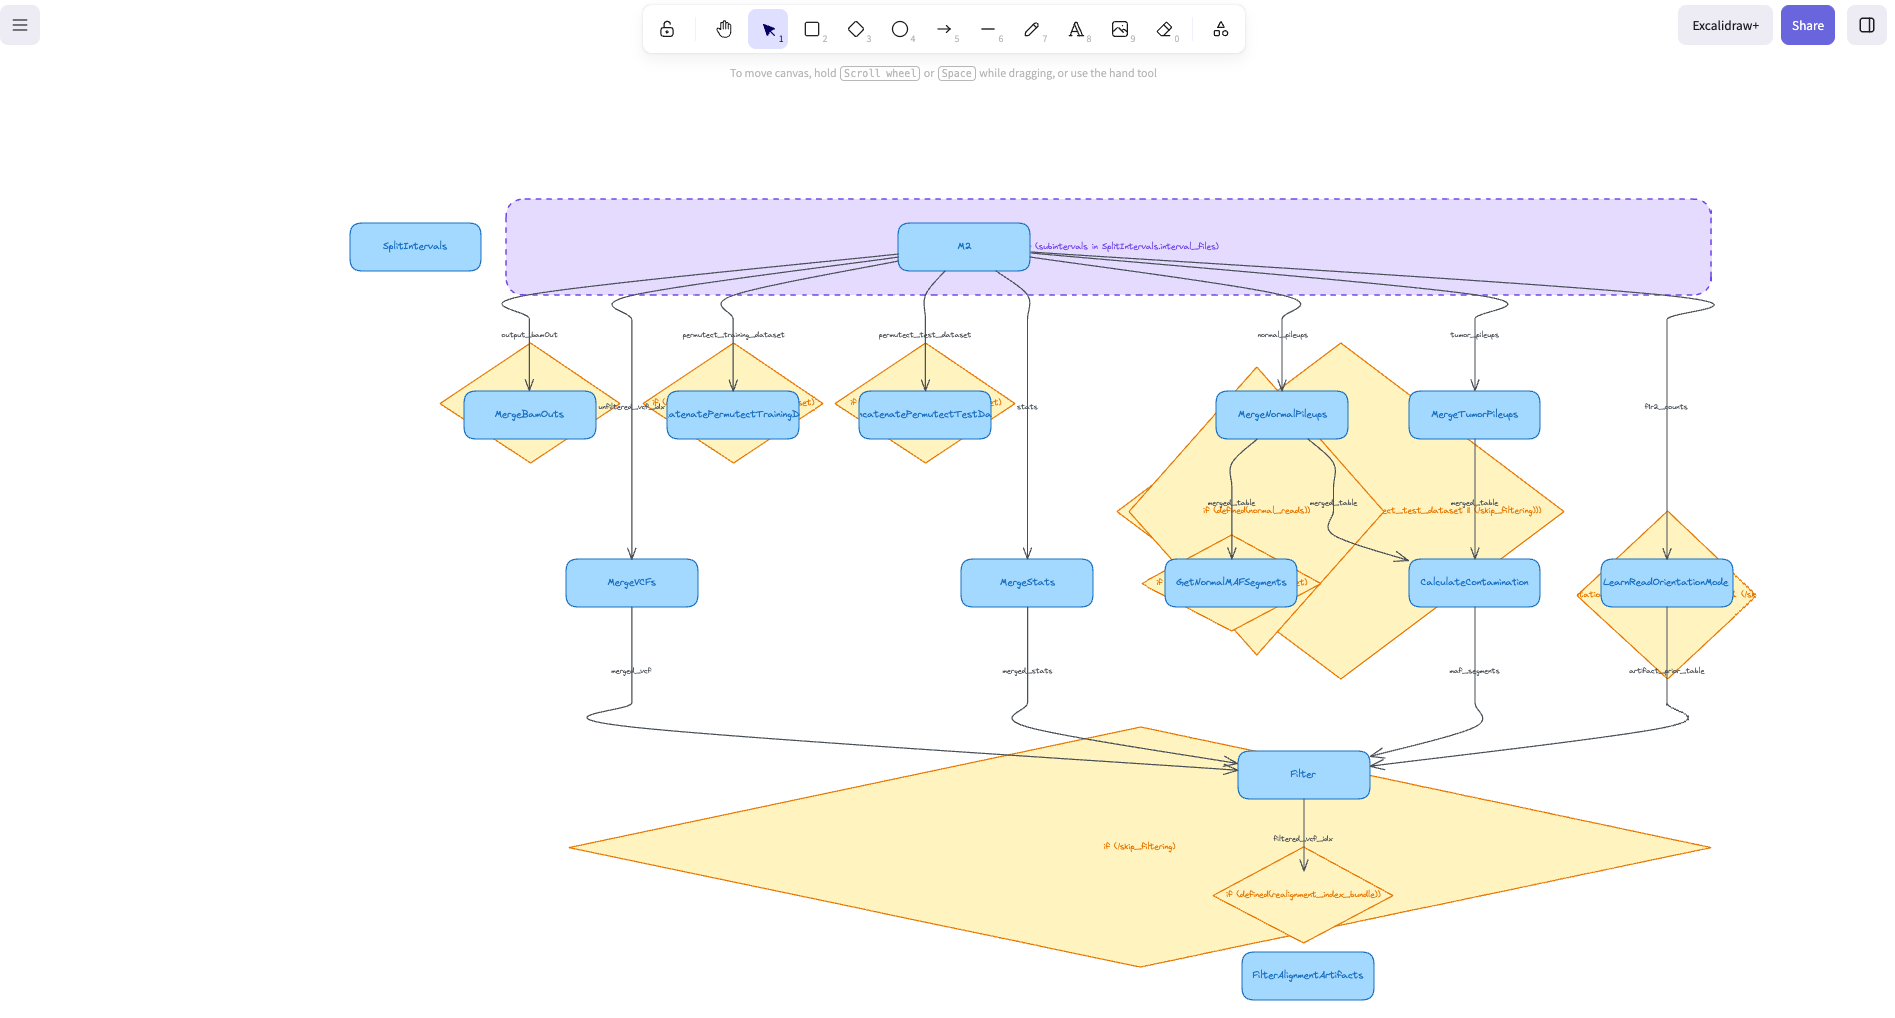
Here’s an example of a WDL pipeline rendered by wdldraw:
MCP Server Integration
wdldraw runs as an MCP server, which means AI agents can use it directly. Configure it in your .mcp.json:
{
  "mcpServers": {
    "wdldraw": {
      "command": "npx",
      "args": ["tsx", "/path/to/wdldraw/src/index.ts"]
    }
  }
}
The server exposes a render_wdl tool that accepts a file path and an optional layout direction (TB for top-bottom, LR for left-right). When you ask Claude or another MCP-capable agent to “visualize this pipeline,” it calls wdldraw, gets back Excalidraw JSON, and can present or save the diagram.
This fits naturally into a bioinformatics workflow: you’re writing or reviewing a WDL pipeline with an AI assistant, and you ask it to draw the execution graph without leaving your editor.
Example
Given a WDL workflow with quality control, alignment, variant calling, and a scatter over chromosomes for parallel processing, wdldraw produces a DAG showing:
- The linear chain of preprocessing steps
- A scatter container around the parallelized calling tasks
- Conditional branches for optional filtering
- Labeled edges showing which outputs feed into which inputs
The result is a hand-drawn-style diagram that you can immediately share with your team, paste into a design doc, or use during a pipeline review.
Tech Stack
| Layer | Technology |
|---|---|
| Parser | tree-sitter-wdl |
| Graph IR | Custom TypeScript |
| Layout | dagre |
| Output | Excalidraw JSON |
| Server | @modelcontextprotocol/sdk |
| Runtime | Node.js 18+ |
Why Excalidraw
I chose Excalidraw as the output format for a few reasons:
- Editable: The JSON is a living document. Rearrange nodes, add annotations, change colors - it’s not a static PNG.
- Collaborative: Paste into excalidraw.com and share a link. Your team can annotate the diagram together.
- Hand-drawn aesthetic: Pipeline diagrams end up in presentations, design docs, and PRs. The sketch style communicates “this is a conceptual view” rather than “this is the final architecture,” which is exactly the right framing for a workflow DAG.
- Embeddable: Excalidraw components exist for React and other frameworks, making it easy to integrate into internal tools.
What’s Next
wdldraw is currently a prototype, but the foundation is solid. Areas I’m exploring:
- Subworkflow support - rendering imported workflows as collapsible groups
- Runtime overlay - coloring nodes by execution status from Cromwell metadata
- CWL support - extending the parser to handle Common Workflow Language files
- Web UI - a standalone page where you paste WDL and get a diagram instantly
The code is on GitHub under MIT license.